What is a key performance indicator?
A key performance indicator is a statistic used to assess performance. KPIs are used to analyze the success of a business or a specific activity against specified predetermined levels.
Choosing suitable key performance indicators to track
- Choose one or two metrics that are linked to each of your goals.
While your company has numerous statistics that are critical to its operations and profitability, keeping track of everything that is going on within is impossible and inefficient. Not all metrics are worth keeping track of; furthermore, measuring too many metrics produces extra effort that is ultimately ineffective.
Instead, for each of your objectives, identify one or two metrics that will be most helpful in accomplishing them. Multiple measures may be applicable, but only a few will have a significant influence to increase performance.
- Check to see if your metrics match the requirements for a good KPI.
Consider the following questions for each KPI youre considering:
- Is it possible to quantify it?
- Is this KPI something we can use to influence/drive change, or is it something we cant control?
- Is there a link between this KPI and our overarching strategy and goal?
- Is it easy to define and comprehend?
- Is it possible to measure it in a timely and precise manner?
- Is it useful from a variety of angles, such as customer, financial, internal processes, learning, and growth?
- Is it likely to remain important in the future?
If you answered "no" to many of these questions, its possible that the KPI needs to be changed or replaced entirely.
- Assign particular people to be in charge of each KPI.
KPIs are a crucial tool for tracking success, but they are more likely to be implemented if someone is accountable for tracking and reporting on them. An added benefit is that the responsible party is more likely to want the measure to succeed rather than accept poor results.
- KPIs should be monitored and reported on.
On a monthly, quarterly, or another predetermined reporting schedule, you must regularly analyze your KPIs and their performance. Regular monitoring makes it simple to see when something has underperformed or overperformed and what may have occurred during that time to trigger the difference.
Its critical to share these findings with all relevant parties to ensure that the entire team is on the same page—and because many indicators and goals are interconnected. Using customizable dashboards to report to various audiences is an excellent (and simple) way to do it. You can create one dashboard for departments working on KPIs and another for leadership teams to get a high-level picture.
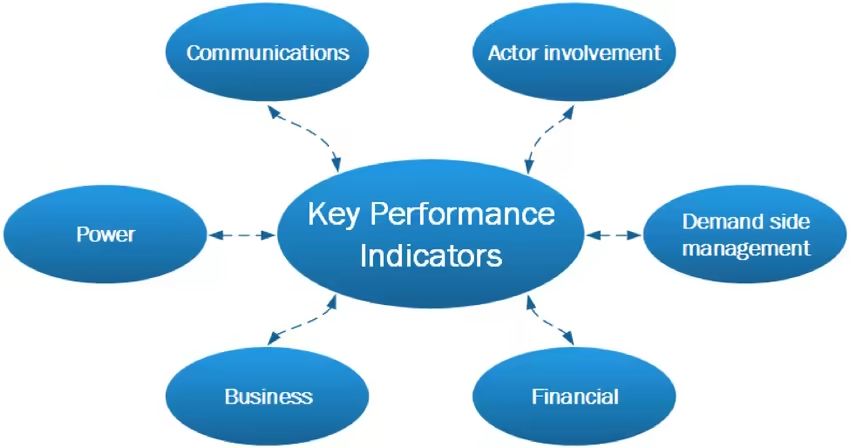
Examples and Definitions of Key Performance Indicators by functional area
Please note that the list below is not exhaustive but creates a general image of areas to consider tracking.
Financial Key Performance Indicators
Financial KPIs are among the most widely utilized measures. They are measures that companies use to monitor, evaluate, and assess their financial health. This is great for benchmarking, and it can show you how well your company is doing compared to its goals, past performance, and competition.
- Profitability:
- Profitability refers to a companys ability to generate a profit on investment based on its resources vs an alternative investment.
- Examples of profitability KPIs are:
- Net Profit margin: The Net Profit Margin KPI determines how profitable your company is for every dollar of revenue it generates. The margin can also be evaluated at the gross profit and operating profit level, depending on your firms leverage and operations.
- It is calculated by dividing Net Profit by Total Revenue.
- Return on Assets: Examines how well the business has utilized its assets to generate profits.
- It is calculated by dividing Net Profit by Total Asset value,
- Return on Equity: Examines your ability to create revenue for each unit of shareholder stock to determine profitability.
- It is calculated by dividing Net Profit by Value of Shareholder Equity.
- Liquidity:
- The ease with which an asset, or security, can be changed into immediate cash without impacting its market price is liquidity.
- Examples of liquidity KPIs are:
- Networking capital: What is left after current liabilities are subtracted from current assets; thus, it is the cash available to govern the businesss daily operations.
- It is calculated by subtracting total liabilities due within twelve months from total assets expected to be utilized within twelve months at a point in time.
- Current Ratio: The current ratio provides an investor with a better understanding of a companys ability to pay its current liabilities.
- It is calculated by dividing current assets by current liabilities.
- Solvency:
- Solvency refers to a companys capacity to pay its long-term debts and financial responsibilities. Because it is one means of demonstrating a companys ability to run its activities into the foreseeable future, solvency can be an essential metric of financial health.
- Examples of solvency KPIs are:
- Debt-To-Assets Ratio: It calculates a firms leverage and shows how much of the company is funded by debt vs assets and the companys ability to repay debt with available assets.
- It is calculated by dividing total debt by total assets.
- Debt-to-Equity Ratio: The debt-to-equity ratio is similar to the debt-to-assets ratio in that it shows how debt is used to fund a company. The higher the ratio, the more debt a business has on its books, and the greater the risk of default.
- It is calculated by dividing total debt by total assets.
- Interest Coverage Ratio: The interest coverage ratio determines how many times a companys available earnings can cover its existing interest payments.
- It is calculated by dividing earnings before interest and tax by interest expenses.
- Efficiency:
- The fundamental reduction in the number of wasted resources utilized to generate a given number of goods or services is referred to as efficiency. Economic efficiency is the result of optimizing resource use to serve an economy best.
- Examples of efficiency key performance indicators are:
- Accounts Receivables Turnover: This operational statistic is used to measure a companys ability to recover receivables. Financial and operational managers frequently use this metric as a leading indicator of market conditions.
- It is calculated by dividing the total revenue generated by average trade receivables.
- Accounts Payable Turnover: An operational performance indicator that measures how many times a companys accounts payable are paid off in a certain period. A higher score suggests that a corporation is more likely to pay its debts on schedule.
- It is calculated by dividing the total purchases by the average accounts payable.
- Cash Conversion Cycle: It takes a corporation a certain amount of time to turn its inventory investment into cash by selling it, the time taken is what the conversion cycle measures.
- It is made up of 3 other KPIs, namely, accounts receivable days, accounts payable days, and days inventory outstanding.
- It is calculated by subtracted the accounts payable days from the sum of days inventory outstanding and accounts receivable days.
Customer-oriented Key Performance Indicators
These key performance indicators focus on tracking the companys relationship with customers and its effects.
- Customer Satisfaction: Customer satisfaction refers to a customers overall enjoyment when interacting with a companys products and services.
- The information can be gathered in a survey then moderated for analysis.
- Customer Service: A companys support and guidance to customers who buy or use its products or services.
- Examples of customer service key performance indicators are:
- A number of complaints: The number of complaints received from customers in a specified period.
- This can be compared to past periods and industry benchmarks to determine the level of performance.
- Average query resolution time: The average period of time it takes for a customer to be assisted with a query.
- This can be compared to past periods and industry benchmarks to determine the level of performance.
- Brand Image: a customers or potential customers overall perception of a product.
- The information can be gathered in a survey then moderated for analysis.
- Customer Retention: Customer retention refers to a set of operations that a company undertakes in order to improve the number of repeat customers and the profitability of each existing customer.
- Examples of customer retention key performance indicators are:
- Retention rate: the number of clients who return to your business to make additional purchases.
- Attrition rate: The number of customers who have stopped buying from your company.
Employee related Key Performance Indicators
The main focus of these key performance indicators is to determine whether or not the culture in the workplace is positive and conducive to production as well as note areas for improvement with regards to workforce management.
- Employee Engagement: Employee engagement refers to how enthusiastic people are about their jobs, how devoted they are to the organization, and how much discretionary effort they put into their work.
- The information can be gathered in a survey then moderated for analysis.
- Training hours per employee: The number of hours employees have been trained for their relevant skills.
- Internal Promotions vs External Hires: This represents the companys ability to train and nurture skilled employees for better roles.
- It is calculated by dividing the number of internal promotions for new positions that arose by the number of external hires.
- Range Penetration: Range penetration is a pay metric that compares an employees salary to the overall pay range for their job or similar jobs at other organizations. This pay comparison shows how much the employees compensation has progressed within the pay range.
It is calculated by subtracting the range minimum from the employees salary and dividing that by the difference between the range maximum and range minimum.
The range limits are to do with market comparisons for similar positions.
Tracking key performance indicators assists organizations in measuring their progress and identifying ways to improve their operations. A company that commits to tracking some of the KPIs explored above will be well on the way to doing this. Though the list is not exhaustive, it creates a good starting point for a company hoping to kick-start growth.