Today, most organizations emphasize data to drive business decisions, and rightfully so. But data alone is not the goal. Facts and figures are meaningless if you can’t gain valuable insights that lead to more informed actions.

The big data revolution has given birth to different kinds, types, and stages of data analysis. Boardrooms across companies are buzzing around with data analytics, to offer organization-wide solutions for business success. However, what do these mean to businesses? The key to companies successfully using Big Data is by gaining the right information which delivers knowledge, and gives businesses the power to gain a competitive edge. The main goal of big data analytics is to help organizations make smarter decisions for better business outcomes. Big data analytics cannot be considered a one-size-fits-all blanket strategy. What distinguishes the best data scientist or data analyst from others, is their ability to identify the different types of analytics that can be leveraged to benefit the business. Thomas Jefferson once said, “Not all analytics are created equal.” He was right, not all analytics are equal.
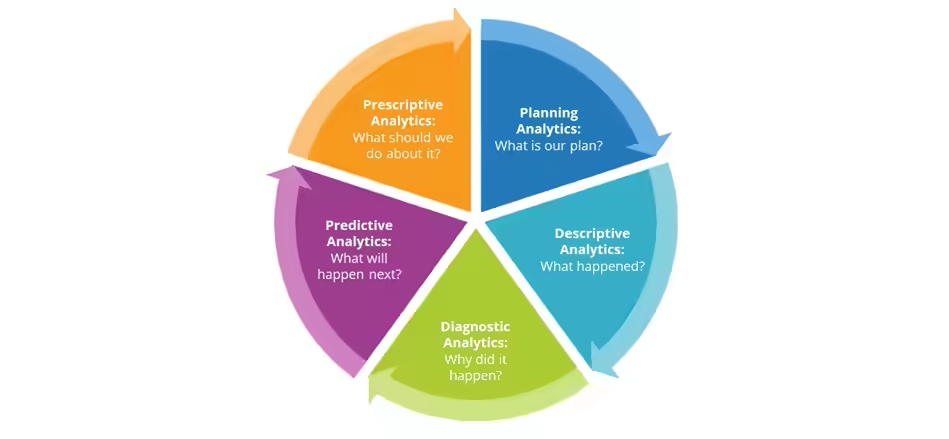
Types of data analytics
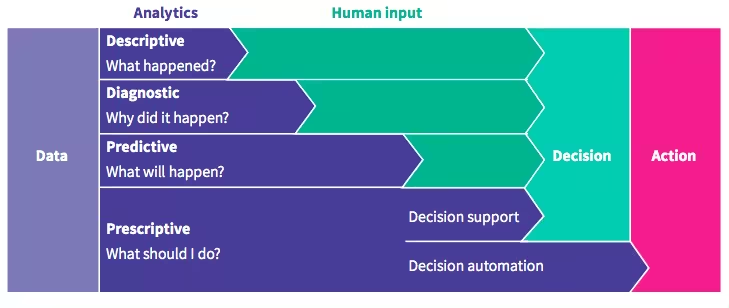
Analytics solutions offer a convenient way to leverage business data. But the number of solutions on the market can be daunting and many may seem to cover a different category of analytics. How can organizations make sense of it all? Start by understanding the different types of analytics, including descriptive, diagnostic, predictive, and prescriptive analytics.
Descriptive analytics
Descriptive analytics looks at data statistically to tell you what happened in the past. Descriptive analytics helps a business understand how it is performing by providing context to help stakeholders interpret information. This can be in the form of data visualizations like graphs, charts, reports, and dashboards. 90% of organizations today use descriptive analytics which is the most basic form of analytics.
A business learns from past behaviors to understand how they will impact future outcomes. Descriptive analytics is leveraged when a business needs to understand the overall performance of the company at an aggregate level and describe the various aspects.
The best example to explain descriptive analytics is the results that a business gets from the web server through Google Analytics tools. The outcomes help understand what happened in the past and validate if a promotional campaign was successful or not based on basic parameters like page views.
Diagnostic analytics
Diagnostic analytics takes descriptive data a step further and provides deeper analysis to answer the question: Why did this happen? Often, diagnostic analysis is referred to as root cause analysis. This includes using processes such as data discovery, data mining, and drill down and drill through.
Predictive analytics
Predictive analytics takes historical data and feeds it into a machine-learning model that considers key trends and patterns. The model is then applied to current data to predict what will happen next.
Prescriptive analytics
Prescriptive analytics takes predictive data to the next level. Now that you have an idea of what will likely happen in the future, what should you do? It suggests various courses of action and outlines what the potential implications would be for each.
Both descriptive analytics and diagnostic analytics look to the past to explain what happened and why it happened. Predictive analytics and prescriptive analytics use historical data to forecast what will happen in the future and what actions you can take to affect those outcomes. Forward-thinking organizations use a variety of analytics together to make smart decisions that help your business—or in the case of our hospital example, save lives.
What is the difference between descriptive and predictive analytics?
Below we provide a detailed explanation of predictive analytics and descriptive analytics in clear point formats;
- Descriptive Analytics will give you a vision of the past and tells you: what has happened? Whereas Predictive Analytics will recognize the future and tells you: What might happen in the future?
- Descriptive Analytics uses Data Aggregation and Data Mining techniques to give you knowledge about the past but Predictive Analytics uses Statistical analysis and Forecast techniques to know the future.
- Descriptive analytics is used when you need to analyze and explain different aspects of your organization whereas Predictive Analytics is used when you need to know anything about the future and fill in the information that you do not know.
- A descriptive model will exploit the past data that are stored in databases and provide you with an accurate report. A Predictive model identifies patterns found in past and transactional data to find risks and future outcomes.
- Descriptive analytics will help an organization to know where they stand in the market, and present facts and figures. Whereas predictive analytics will help an organization to know, how they will stand in the market in the future and forecasts the facts and figures about the company.
- Reports generated by Descriptive analysis are accurate but the reports generated by Predictive analysis are not 100% accurate it may or may not happen in the future.
How to carry out descriptive analytics
Descriptive analytics uses two key methods, data aggregation and data mining (also known as data discovery), to discover historical data. Data aggregation is the process of collecting and organizing data to create manageable data sets. These data sets are then used in the data mining phase where patterns, trends, and meanings are identified and then presented in an understandable way.
IBM Business Analytics Blog guest writer Dan Vesset breaks the descriptive analytics process into five broad steps:
- Business metrics are decided. First, metrics are created that will effectively evaluate performance against business goals, such as improving operational efficiency or increasing revenue. Vesset says the success of descriptive analytics heavily relies on KPI (key performance indicator) governance. ‘Without governance,’ he writes, ‘there may not be a consensus regarding what the data means, thus guaranteeing analytics a marginal role in decision making.’
- The data required is identified. Data is sourced from repositories such as reports and databases. ‘To measure accurately against KPIs,’ Vesset says, ‘companies must catalog and prepare the correct data sources to extract the needed data and calculate metrics based on the current state of the business.
- The data is collected and prepared. Data preparation – depublication, transformation, and cleansing, for example – takes place before the analysis stage and is a critical step to ensure accuracy; it is also one of the most time-consuming steps for the analyst.
- The data is analyzed. Summary statistics, clustering, pattern tracking, and regression analysis are used to find patterns in the data and measure performance.
- The data is presented. Finally, charts and graphs are used to present findings in a way that non-analytics experts can understand.
What’s the benefit of descriptive analytics to businesses?
Companies benefit from descriptive analytics because it streamlines the data analyzing process. Most corporations collect large volumes of data from structured data (forms) and media-rich unstructured data. By investing in analytics, companies can integrate both data structures for a comprehensive overview of operations.
With data analytics, companies can improve their productivity because analytics paves the way for innovations that will lead to new operational methods that in turn improve productivity.
Descriptive analytics reveals unique insights, trends, and patterns in data not found through other analytical methods by leveraging several sophisticated methods for analysis, like regression, summary statistics, and clustering to reveal these new patterns. Thereby, opening new opportunities for growth and cutting operating costs.
Data analytics gives context to vital information. For example, $1 million in sales is an impressive accomplishment, but if there is no further context to the sales figure, then it is not very useful. Data analytics provides the context managers, executives and stakeholders need to make decisions.
Companies collect a lot of data, and analytics is needed to sift through the relevant information. For example, Google has more than 108 million users, Facebook has 1.1 billion monthly visits, and Amazon has uniquely 89 million visitors each month. Companies are collecting a lot of data, but it is only useful if there is a suitable analytics system to sift through the information.